Aerodrome & Airspace Engineering

Airfield Planning & Analytical Frameworks

Universal Aerospace Solutions executes comprehensive aeronautical diagnostics and layout optimizations in strict compliance with **ICAO Annex 14 (Volume I Aerodromes)** and **FAA Part 157 / Part 77** parameters [INDEX]. Our capabilities bridge core civil aviation criteria with high-fidelity structural data.

Master Plan 1
Master Plan 2
Master Plan 3

Airport Master Planning

Development of core frameworks including comprehensive Airfield Master Plans, ALP Updates, Terminal Planning and Design, Aviation Demand Forecasting, Capacity/Delay Analyses, and detailed Facility Requirement Scale Planning.

Capacity 1
Capacity 2
Capacity 3

Airfield Capacity Analytics

Advanced data diagnostics spanning Facility Utilization, Delay Reduction Measures, Dynamic Queuing Models, Runway Evaluation Performance (REDIM), and multi-source data mining across PASSUR, TARGETS, and ANOMS platforms [INDEX].

Terminal 1
Terminal 2
Terminal 3

Terminal Design Study

Strategic modeling of structural passenger flow spacing, processing bottleneck optimization, concourse space allocation simulations, gate capacity constraints, and seamless security/baggage checkpoint transit design.

Our Extended Analytical Capabilities Matrix

• Traffic Simulation Modeling: Running dynamic fleet trajectories utilizing specialized TAAM, SIMMOD, and AirTop suites.
• Aircraft Swept Path Analysis: Evaluating exact turning radiuses and wheel track envelopes via AeroTurn and PathPlanner tracks.
• Environmental Acoustics Planning: Structural mapping and modeling of airfield noise distributions using INM frameworks.
• Multi-Aircraft Stand Siting: Apron MARS parking reconfigurations, runway rapid-exit taxiway geometry, and gate optimization studies [INDEX].
Engineering Blueprint & Layout Criteria

AWF Technical Specifications

Universal Aerospace Solutions translates strict international statutes into exact physical installation blueprints. In strict accordance with **ICAO Annex 14 Chapter 6** criteria [INDEX], we specify the required geometric parameters, color distributions, and visual layout dimensions to secure utility line safety zones.

Tower Painting 1
Tower Painting 2
Tower Painting 3

Aviation Color Banding

High-contrast red and white durable paint banding configurations applied across seven (7) equal structural layers. Individual sections remain bounded within **30-meter width thresholds** to lock in daytime pilot line-of-sight visibility rules [INDEX].

Lighting 1
Lighting 2
Lighting 3

Active Flashing Beacons

Dual-level layout specifications for intermediate and top pylon segments. Systems are engineered without LED nodes inside specific routes to prevent severe tracking reflections across emergency pilot **Night Vision Goggles (NVG)** [INDEX].

Marker Balls 1
Marker Balls 2
Marker Balls 3

Overhead Catenary Markers

Spherical markers exceeding 600mm diameter mapped across highest circuit shield wires (OPGWs). Elements utilize an alternating, staggered alignment to enforce an optimal **60-meter visible protection interval** [INDEX].

Featured Operational Project Rationale

These rigid physical parameters provide the baseline framework for our completed **Aeronautical Study of Aerial Warning Facilities across CLP Power's high-voltage 132kV and 400kV transmission circuits**. By applying these exact staggered dimensions and pylon markers, our studies secure full structural compliance while locking down airspace clearances seamlessly [INDEX].

Empirical Airspace Analytics & Modeling

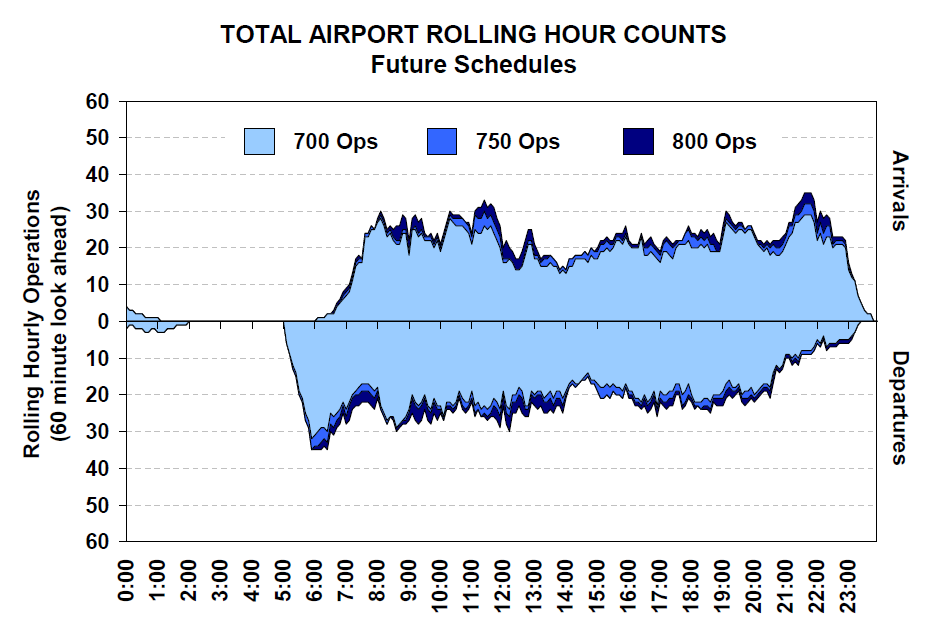
Surveillance & Traffic Density Analytics

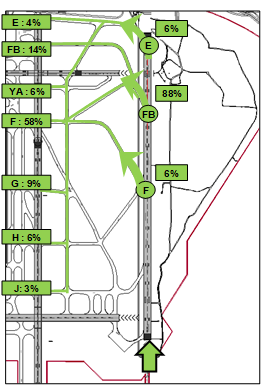
Universal Aerospace Solutions strips guesswork out of asset risk profiling. By deploying advanced **ADS-B surveillance ground tracking arrays**, our engineering models collect and process actual empirical flight trajectories, evaluating real-world traffic intersections across high-voltage utility corridors [INDEX].

ADS-B Tracking 1
ADS-B Tracking 2
ADS-B Tracking 3

ADS-B Traffic Surveillance

Continuous capture of low-altitude flight paths, velocity logs, and approach paths over an extensive **12-month evaluation grid** [INDEX]. Models track seasonal variations and real-world approach streams to establish hard baseline risk figures.

Consolidated Map 1
Consolidated Map 2
Consolidated Map 3

Consolidated Airspace Hotspots

Layering hundreds of independent flight logs simultaneously onto detailed 3D terrain vectors. This macro data consolidation reveals localized conflict centers where aircraft corridors track near grid lines [INDEX].

Zoning 1
Zoning 2
Zoning 3

Strategic Risk Assessment

Mapping strict risk bounds based on altitude bands (**500–1000ft AGL segments**) [INDEX] and stakeholder inputs. We cross-reference commercial fleet movements and emergency flyway counts to sort hazards into CAT 1, 2, or 3 priority tiers [INDEX].

Empirical Operational Calculations

Our risk assessments explicitly factor in real-world fleet density records: tracking **Heliservices commercial operations (~3,600 flights annually)** [INDEX] alongside specialized **Hong Kong Government Flying Service operations (~5,870 GFS flights annually)** [INDEX]. This models a highly precise 30% safety threshold vector, providing grid managers with data-justified clearance filing evidence [INDEX].